Using the VLAB
Ask Ian if you need any help or encounter any problems with the VLAB or using the Xilinx tools remotely, or if you need a key to access the VLAB.
Info
A more “step by step” version of this page exists, particularly for EMBS students, at The VLAB Quickstart Guide.
The VLAB is complex infrastructure built specially for teaching here at the University. Please report any bugs or errors (or just annoying things) to us so that we can fix them. If you’re feeling motivated you can help us fix any issues on GitHub!
The Virtual Lab is a rack of FPGA boards that are kept in the RTS Lab and are connected to the internet for your use. These boards are identical to the boards that you have in the hardware lab and the same bitfiles will work. The only difference is that you will not be able to use the buttons on the board, or observe the LEDs, so all interactions with your design will have to be via the UART (serial line). You should plan for this when building your systems.
Current Status of the VLAB
Key Facts
- The VLAB lets you use your existing designs, it doesn’t need anything changing in your hardware or software.
- You will run the client script
vlab.pyto connect to a remote FPGA. - Once connected, you can connect the Xilinx tools (Vivado) to the remote FPGA through the VLAB, in order to program and debug the board.
- The VLAB gives you access to the serial (UART) to let you interact with your design.
Quick Start
The VLAB client requires Python 3, so install this first. The client is tested on Linux and macOS, but should also work on Windows.
Download the Virtual Lab client script from GitHub.
You should have been given a Virtual Lab keyfile which allows you to access the VLAB. If not, speak to a demonstrator. To use the VLAB, run the script to connect and request a board. Note that you must run the VLAB script from the same place as you are running the Xilinx tools. If you are running Vivado remotely, run the script on that remote machine.
For example, to request an EMBS board, use the following:
./vlab.py -k <key file>This defaults to requesting a vlab_zybo-z7 board (the Digilent Zybo Z7-10 FPGAs used in EMBS). To request a different type of board use the -b flag. For example:
./vlab.py -k <key file> -b vlab_zybo-z7If the FPGA is available, you will be connected to the UART terminal on the board. Any keypresses will be sent to the FPGA, and any bytes it sends will appear in your terminal, the same as with a local screen connection. Whilst you are connected, the VLAB allows any of the Xilinx software tools to see the remote FPGA and program it (see below for instructions).
When you connect to the VLAB, you will get an exclusive lock on your allocated board for ten minutes. After this time you won’t immediately be disconnected, but any other user wishing to connect to the same board type may cause your session to end. Your current lock expiry time is shown during connection and at the bottom of the VLAB shell window.
See the README file for more information on client installation and usage.
Using Vitis with the VLAB
You probably want to use the VLAB from Vitis most of the time. First connect to a VLAB board. Then in Vitis in your application component go to Settings -> launch.json and next to “Target Connection” click new. Give it a sensible name like vlab and set the following:
Hostname: localhost
Port: 12345
“Test connection” should report that Vitis could communicate with the FPGA via the VLAB. If all is fine, click OK and ensure that Target Connection is now set to your new vlab connection.
And thats it! From now on, all interactions with that application will now go over the VLAB, and so to work local again, go back in and set Target Connection back to Local [default].
Using Vivado with the VLAB
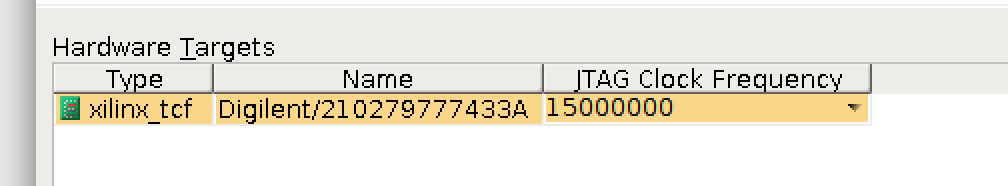
Using the VLAB from Vivado is very similar. In Vivado click “Open Hardware Manager” in the Flow Navigator in the left-hand column. Then click “Open Target” | “Open New Target” in the Flow Navigator. In the Open wizard click Next, select Remote Server, Next, and use the settings from above. Click Next and the tools should connect and see a Zybo Z7:
Click Next and Finish. You can send bitfiles to the FPGA by selecting Program Device from the Flow Navigator.
Exiting the VLAB
Please close your VLAB connection when you are not using it so that other students can use the board (remember that your exclusive lock on a board will expire ten minutes after connecting anyway.).
The VLAB terminal window is running screen. To close it, press and release Ctrl-a, then press ‘k’ and confirm with ‘y’.
When using a Virtex FPGA board (or anything other than a Zynq), errors following the line “fpga configuration failed. DONE PIN is not HIGH” when disconnecting are normal, and can be ignored (we will tidy this up one day…).
Connecting through the SSH Gateway
Due to the University’s firewall rules, the Virtual Lab relay server ( rts001.cs.york.ac.uk ) is only accessible from departmental machines (including student compute servers, staff Linux compute servers, anything on the RTS lab network, and all student lab PCs), or via the IT Services SSH service. Therefore, when off campus or using eduroam, the easiest way to access the VLAB (and other departmental servers) is through the IT Services SSH gateway.
Once you have been granted access to the SSH gateway, the following SSH rules can be used to connect directly through to the VLAB by adding them to the ~/.ssh/config file on the computer you’re connecting from.
Host ssh.york.ac.uk
User YOUR_ITSERVICES_USERNAME

Host rts001.cs.york.ac.uk
User YOUR_VLAB_USERNAME
ProxyCommand ssh -A -T -o Compression=no ssh.york.ac.uk -W %h:%p
The SSH gateway server also accepts key-based authentication, using the ~/.ssh/authorized_keys file from your standard university Linux home directory.
Graphical Output over the VLAB
Viewing HDMI output is not natively supported by the VLAB. However, it is possible to use Xilinx’s USB debugging interface to download the contents of the video frame buffer straight out of the FPGA and view that. Because USB debugging is rather slow, and the video frame is uncompressed it take take a while (around 16 seconds) to pull an entire video frame. However this might still be useful to get an idea for how your code is progressing.
Note that this script assumes that you are running on Linux because it uses ImageMagick and the Gnome Image Viewer. These can be installed on a Debian-based Linux with the following:
sudo apt-get install eog imagemagickYou can avoid installing Eye of Gnome by switching the image viewer the script uses. On the exec eog $filename.png line, switch eog to (for example)gwenview for KDE or open for macOS.
The first task is to get the memory address of the video frame you want to view. In the HDMI example code which you are probably working with, two frame buffers are set up with the following code.
u32 frameBuf[DISPLAY_NUM_FRAMES][MAX_FRAME] __attribute__((aligned(0x20))); // Frame buffers for video data
void *pFrames[DISPLAY_NUM_FRAMES]; // Array of pointers to the frame buffers
This is called multiple buffering and allows the video hardware to be drawing one frame to the screen, whilst the CPU is preparing the next frame. You can get the memory address of a frame by simply printing it out to the console.
printf("Address of frame: %p\n", pFrames[0]);In the HDMI example this will be 0x11ce80 but this is likely to change frequently as you edit your code. Once you have the address of the frame you are interested in, download this script:
readimage.tcl
set height 900
set width 1440
set filename "/tmp/output"

# Default values for $base and $stride
if {![info exists base]} {
	set base 0x11ce80
}

if {![info exists stride]} {
	set stride 20
}

puts "Reading frame..."
set starttime [clock seconds]

set fp [open $filename.bin wb]

# Read line by line. If stride > 1 then duplicate the fetched line that number of times
if {$stride == 1} {
	puts -nonewline $fp [mrd -size w -bin $base [expr $width * $height]]
} else {
	set y 0
	while {$y < $height} {
		set offset [expr $base + ($y * $width * 4)]
		set line [mrd -size w -bin $offset $width]

		for {set i 0} {$i < $stride} {incr i} {
			puts -nonewline $fp $line
		}

		set y [expr $y + $stride]
	}
}

close $fp

set endtime [clock seconds]
set duration [expr $endtime - $starttime]
puts "Frame read in $duration seconds."

# If $stride was not a divisor of $height then calculate the new height
if {[expr $height % $stride]} {
	set newheight [expr (($height / $stride) + 1) * $stride]
} else {
	set newheight $height
}

# Use ImageMagick to convert from BGRA format to png
puts "Attempting to convert $filename.bin to PNG format"

if {[catch {
	exec convert -size ${width}x${newheight} -depth 8 bgra:$filename.bin -alpha off $filename.png
}]} {
	"Error whilst converting. Is convert (from ImageMagick) on the PATH? See: https://imagemagick.org/script/convert.php"
} else {
	puts "Frame converted to output image: $filename.png"
	# Open the resultant image using Eye of Gnome (Image Viewer)
	exec eog $filename.png
}
In Vivado’s menus, select Tools | Run Tcl Console (or in Vitis, Xilinx | XSCT Console) to view the debugging interface. The XSCT console has the prompt xsct%. Set the target address of frame and then run the script.
xsct% set base 0x11ce80
xsct% source /path/to/videograb.tcl
This will fetch the frame, convert it to a PNG, and show it in an image viewer. By default the script only grabs every 20th line, but to make it grab the entire frame set the following:
xsct% set stride 1