Debugging Your Hardware
There are a lot of things that can go wrong when building custom hardware. In the software world, tooling builds in debugging support automatically until you explicitly turn it all off. We don’t have that luxury in hardware so we must do it ourselves.
You have already seen testbenches, which are an important tool for testing the functional correctness of your code. However they can only test things at the software abstraction level. They can’t determine issues that come from your use of directives, or from the interfacing between the ARM CPUs and the custom hardware.
General Tips
Have you tried turning it off and on again?
It is possible to get the ARM cores into an unbootable state, so if the tools are reporting strange errors when trying to connect to it, power cycle the board. I have also seen situations when the Linux machine needs to be rebooted (usually because of something left over running from a previous user).
Basic serial output
First, check your terminal is connected. If you connect the screen to the board and type into the window, no characters will appear but you will see a little orange receive light blink on the board. If you don’t even see that, try to connect to a different device node (/dev/ttyUSB1, /dev/ttyUSB2 etc.).
Once done, check your ARM software is OK and that you can see the output of printf calls. Then, check that you can talk to the IP core by calling one of the setter APIs like xtoplevel_set_arg1 or similar.
xtoplevel_set_arg1(test);
printf("Do you see this output?\n");
If you see that output then the ARM core is able to talk to the IP core, and so the AXI Slave connection is correctly connected. You can further verify this by calling “set” and then checking that the corresponding “get” gives you the same value back. If not, then something more fundamental is wrong.
Screen immediately closes when I try to run it
It is probably already running in the background. You can reconnect to an existing screen with screen -r. Or just turn off the FPGA and all connected screens will close.
Have you run out of disk space?
Vitis Issues
Regenerate Sources
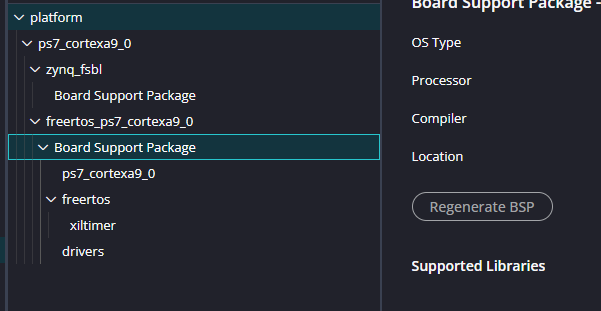
Sometimes we need to tell Vitis to regenerate the BSP. It should do this automatically but if it isn’t including a driver that we expect this can help. In your application select vitis-comp.json and then select your Board Support Package. Note that the FSBL (bootloader) has a Board Support Package but we don’t care about that one. Yours will be either the “standalone” or “freertos” one, as in this screenshot.
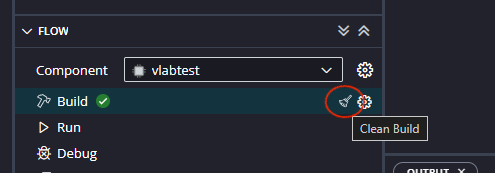
Click Regenerate BSP, and it will rebuild the BSP. Then clean and rebuild your project. This builds the driver code and ensures the software interfaces are up to date. To clean build, click the little broom icon which appears when you hover your mouse over the Build control.
Linker errors
If when you are compiling your application you get an error that a symbol is not defined (i.e. it can’t find a function that you think it should be able to) then we should check that it is actually compiling all of your .c files. In your application, go to settings -> UserConfig.cmake -> Compile Sources and ensure that all of your .c (or .cpp) files are listed. You don’t need to list headers (.h).
Check you are programming the correct bitfile
Are you programming the FPGA with the correct bitfile? If your ARM code appears to just hang when trying to talk to something on the FPGA (your IP core or something like a GPIO) then it could be because the hardware is not being programmed with an up-to-date bitfile. Again, this shouldn’t be an issue but sometimes can be.
In your application, select Settings -> launch.json and you will see the process that happens when you click “Run”. “Bitstream File” is probably set to
${workspaceFolder}/projectname/_ide/bitstream/design_1_wrapper.bit
This should be a copy of your most recent created bitfile, but you can force this by setting it to point to the one directly created by Vivado. Click browse and set it to:
/location/of/your/vivado/project/projectname.runs/impl_1/design_1_wrapper.bit
Now rerun and see if that helps. You can check the modify date/time of the two files to see if this was the problem.
Vivado seems to crash/hang
There is a known bug in the Linux distribution we have that can cause the UI to become “detached” from the tooling. It is probably still running in the background, so you should wait until it is finished, kill Vivado, and reopen your project and you will see that it is complete. You can verify that it is done by checking whether there is significant CPU usage with top, or checking the modify date of the output bitstream. If this file:
${workspaceFolder}/projectname/_ide/bitstream/design_1_wrapper.bit
was modified recently then Vivado is done and you can xkill it.
FreeRTOS and lwIP
FreeRTOS tasks “delay” but then never wake up
If you have code like the following:
void my_task(void *p) {
    xil_printf("Start\r\n");
    while (1) {
        xil_printf("Ping\r\n");
        vTaskDelay(500 / portTICK_RATE_MS);  // Delay 500ms
    }
}
but you see output like this:
Start
Ping
and nothing else, then double check how you set up the xiltimer settings. If the timers are not enabled in Vivado and then activated in the BSP then FreeRTOS cannot wake tasks up. Easiest is to reimport your XSA as a new hardware component, and create a new FreeRTOS BSP on it, then retarget your application to that new BSP.
tcpip_thread overflowing its stack
You might get an error saying that the tcpip_thread has overflowed its stack. The stack for that thread is big enough if used correctly, so this indicates that you are doing something which lwIP does not recommend. tcpip_thread runs callbacks, for example if you set up a callback like in the ethernet example:
udp_recv(pcb, recv_callback, NULL);then recv_callback will be called every time this PCB receives a packet. That call is made by tcpip_thread. That means that your callbacks shouldn’t do any real work, they should just parse the packet and queue it into a data structure for proper processing later by your code on a thread that you control the stack (and priority) of.
Vitis HLS (custom hardware) Issues
You should always check that you are programming with the most up to date bitfile.
Debug Interfaces
Once you start making your own hardware IP cores with HLS, you will need to construct hardware which is designed to be debugged. Let’s imagine the following custom hardware IP core:
uint32 toplevel(uint32 *ram) {
#pragma HLS INTERFACE m_axi port=ram offset=slave bundle=MAXI
#pragma HLS INTERFACE s_axilite port=return bundle=AXILiteS

  ram[2] = ram[1] + ram[0];
  return 0;
}
This hardware simply adds two number in main memory together and stores the result in a third. If we run this and nothing happens, how do we know what is wrong? There are (at least) the following problems that we need to isolate in order to debug this:
- Your code
- Some problem in the tooling - a corrupted project etc.
- You forgot to rebuild and reexport the hardware
- The AXI Slave interface (IP core to CPU)
- The AXI Master interface (IP core to main memory)
- …and probably a few other things
We can make the situation better by building in debug interfaces. Look at the following small modification.
uint32 toplevel(uint32 *ram, int version) {
#pragma HLS INTERFACE m_axi port=ram offset=slave bundle=MAXI
#pragma HLS INTERFACE s_axilite port=return bundle=AXILiteS
#pragma HLS INTERFACE s_axilite port=version bundle=AXILiteS

  version = 42;
  ram[2] = ram[1] + ram[0];
  return 0;
}
We’ve added a version parameter and bundled it into the AXI Slave interface. Now from the Arm CPU we can use the generated API call (which will be called XToplevel_Get_version()) to read this, and if we get 42 then we know that our projects are set up correctly and that we have wired up the slave interface. We can also at any point change this value, rebuild everything, and reassure ourselves that we are running the latest version of everything.
Debug Modes
You can also construct entire debugging modes. Read this code:
uint32 toplevel(uint32 *ram, int version, int mode, int arg1, int arg2) {
#pragma HLS INTERFACE m_axi port=ram offset=slave bundle=MAXI
#pragma HLS INTERFACE s_axilite port=return bundle=AXILiteS
#pragma HLS INTERFACE s_axilite port=version bundle=AXILiteS
#pragma HLS INTERFACE s_axilite port=mode bundle=AXILiteS
#pragma HLS INTERFACE s_axilite port=arg1 bundle=AXILiteS
#pragma HLS INTERFACE s_axilite port=arg2 bundle=AXILiteS

    version = 42;

    switch(mode) {
        //Do our normal thing
        case 0:
        ram[2] = ram[1] + ram[0];
        return 0;

        //Simple AXI Slave test
        case 1:
        return arg1 + arg2;

        //AXI Master read tests
        case 2:
        return ram[0];
        case 3:
        return ram[arg1];

        //AXI Master write tests
        case 4:
        ram[arg1] = arg2;
        return 1;
    }
}
Here, we have added alternate execution modes that let us test different bits of functionality, thereby narrowing down the problem. By setting mode and the debug parameters arg1 and arg2 we can peek and poke main memory and thereby observe the effects from the CPU. If mode 1 is working, but mode 2, 3 and 4 aren’t, then maybe we wired up the slave interface correctly but not the master interface.
You can carry this concept forward into your actual hardware design. Instead of treating it as a single monolithic block, alternate execution modes and debugging registers can help a lot with figuring out why something isn’t doing what you expect.